Trade US Tech 100 Future - NQZ2025 CFD
Add to favourite- Summary
- Historical Data
Trading Conditions
| Spread | 1.8 | ||||||||
|
Long position overnight fee
Long position overnight fee
Go to platform | -0.01096% | ||||||||
|
Short position overnight fee
Short position overnight fee
Go to platform | -0.01096% | ||||||||
| Overnight fee time | 22:00 (UTC) | ||||||||
| Min traded quantity | 0.001 | ||||||||
| Currency | USD | ||||||||
| Margin | 0.33% | ||||||||
| Stock exchange | United States of America | ||||||||
| Commission on trade | 0% |
*Information provided by Shares.com
- Last Week
- Last Month
- Last Year
- Last two Years
- Max
- Daily
- Weekly
- Monthly
| Date | Close | Change | Change (%) | Open | High | Low |
|---|---|---|---|---|---|---|
| Nov 27, 2025 | 25314.5 | -7.5 | -0.03% | 25322.0 | 25338.0 | 25303.6 |
| Nov 26, 2025 | 25322.6 | 237.2 | 0.95% | 25085.4 | 25374.1 | 25066.5 |
| Nov 25, 2025 | 25085.5 | 126.6 | 0.51% | 24958.9 | 25134.6 | 24602.7 |
| Nov 24, 2025 | 24959.7 | 489.5 | 2.00% | 24470.2 | 24992.0 | 24361.7 |
| Nov 23, 2025 | 24470.5 | -56.4 | -0.23% | 24526.9 | 24532.1 | 24456.1 |
| Nov 21, 2025 | 24345.9 | 210.0 | 0.87% | 24135.9 | 24594.7 | 23903.9 |
| Nov 20, 2025 | 24136.0 | -970.9 | -3.87% | 25106.9 | 25308.0 | 24019.4 |
| Nov 19, 2025 | 25107.9 | 521.3 | 2.12% | 24586.6 | 25109.5 | 24446.2 |
| Nov 18, 2025 | 24589.7 | -328.4 | -1.32% | 24918.1 | 24958.2 | 24379.6 |
| Nov 17, 2025 | 24918.2 | -250.5 | -1.00% | 25168.7 | 25360.1 | 24734.4 |
| Nov 16, 2025 | 25169.2 | 25.6 | 0.10% | 25143.6 | 25187.1 | 25021.9 |
| Nov 14, 2025 | 25140.1 | 33.1 | 0.13% | 25107.0 | 25291.9 | 24625.4 |
| Nov 13, 2025 | 25106.7 | -433.3 | -1.70% | 25540.0 | 25720.4 | 25003.1 |
| Nov 12, 2025 | 25539.7 | -111.5 | -0.43% | 25651.2 | 25811.2 | 25488.1 |
| Nov 11, 2025 | 25649.2 | -92.8 | -0.36% | 25742.0 | 25767.6 | 25479.1 |
| Nov 10, 2025 | 25741.6 | 407.1 | 1.61% | 25334.5 | 25759.1 | 25268.5 |
| Nov 9, 2025 | 25334.7 | -23.9 | -0.09% | 25358.6 | 25378.0 | 25296.9 |
Trading calculator
Calculate your hypothetical P&L if you had opened a CFD trade on a certain date (select a date) and closed on a different date (select a date).
Trade commission
0
- 1:1
- 5:1
- 10:1
- 20:1
- 50:1
- 100:1
- 200:1
Leverage
200:1
- 20
- 100
- 500
- 1000
- 10000
Investment
Trade size (Leverage x Investement):
Open
Close
Short Long
US Tech 100 - Dec 2025
US Tech 100 - Dec 2025.News

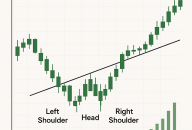
Inverse Head and Shoulders Pattern: A Comprehensive Guide
Learn how to recognize and trade the Inverse Head and Shoulders pattern — a key bullish reversal signal in technical analysis. Understand its structure, significance, and application in various markets.
14:58, 2 July 2025
Understanding Risk Management in Trading | Key Tools & Strategies
Learn how risk management in trading helps protect your capital. Explore essential tools like stop-losses, hedging, leverage control, and diversification.
11:10, 26 June 2025People also watch
Still looking for a broker you can trust?
Join the 570.000+ traders worldwide that chose to trade with Shares.com