Trade Yalla Group Limited - YALA CFD
Add to favourite- Summary
- Historical Data
Trading Conditions
| Spread | 0.34 | ||||||||
|
Long position overnight fee
Long position overnight fee
Go to platform | -0.023624% | ||||||||
|
Short position overnight fee
Short position overnight fee
Go to platform | 0.001401% | ||||||||
| Overnight fee time | 21:00 (UTC) | ||||||||
| Min traded quantity | 1 | ||||||||
| Currency | USD | ||||||||
| Margin | 5.00% | ||||||||
| Stock exchange | United States of America | ||||||||
| Commission on trade | 0% |
*Information provided by Shares.com
Key Stats
| Prev. Close | 7.78 |
| Open | 7.56 |
| 1-Year Change | 48.53% |
| Day's Range | 7.32 - 7.56 |
- Last Week
- Last Month
- Last Year
- Last two Years
- Max
- Daily
- Weekly
- Monthly
| Date | Close | Change | Change (%) | Open | High | Low |
|---|---|---|---|---|---|---|
| Aug 1, 2025 | 7.36 | -0.22 | -2.90% | 7.58 | 7.58 | 7.32 |
| Jul 31, 2025 | 7.78 | 0.36 | 4.85% | 7.42 | 7.86 | 7.42 |
| Jul 30, 2025 | 7.57 | -0.05 | -0.66% | 7.62 | 7.84 | 7.45 |
| Jul 29, 2025 | 7.77 | -0.09 | -1.15% | 7.86 | 7.90 | 7.64 |
| Jul 28, 2025 | 7.85 | 0.26 | 3.43% | 7.59 | 7.85 | 7.42 |
| Jul 25, 2025 | 7.70 | -0.01 | -0.13% | 7.71 | 7.87 | 7.62 |
| Jul 24, 2025 | 8.01 | 0.00 | 0.00% | 8.01 | 8.23 | 7.88 |
Trading calculator
Calculate your hypothetical P&L if you had opened a CFD trade on a certain date (select a date) and closed on a different date (select a date).
Trade commission
0
- 1:1
- 2:1
- 3:1
- 5:1
- 10:1
- 20:1
Leverage
20:1
- 20
- 100
- 500
- 1000
- 10000
Investment
Trade size (Leverage x Investement):
Open
Close
Short Long
Yalla Group Limited
Yalla Group Limited operates a voice-centric social networking and entertainment platform under the Yalla name primarily in the Middle East and North Africa region. Its platform offers group chatting and games services; and sells virtual items, as well as provides upgrade services. The company was formerly known as FYXTech Corporation. Yalla Group Limited was founded in 2016 and is headquartered in Dubai, the United Arab Emirates.News

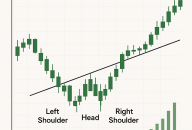
Inverse Head and Shoulders Pattern: A Comprehensive Guide
Learn how to recognize and trade the Inverse Head and Shoulders pattern — a key bullish reversal signal in technical analysis. Understand its structure, significance, and application in various markets.
14:58, 2 July 2025
Understanding Risk Management in Trading | Key Tools & Strategies
Learn how risk management in trading helps protect your capital. Explore essential tools like stop-losses, hedging, leverage control, and diversification.
11:10, 26 June 2025People also watch
Still looking for a broker you can trust?
Join the 570.000+ traders worldwide that chose to trade with Shares.com